Executive Summary

About the Survey: This salary was administered in May 2017 to data, analytics, and technology practitioners in progressive politics. There were 273 respondents (comparable to the 266 respondents in 2016) recruited using snowball sampling: the survey was announced on a few major progressive data e-mail listservs, and readers were encouraged to share the survey around their offices. See Notes for more information about who was eligible. Thank you to everyone who participated in or distributed this survey!

About Respondents: Respondents were 56% men and 76% white with a median age of 25-29. Half of all respondents live in the Washington, DC area.

  • 92% of all respondents have a bachelor’s degree or above, and 68% earned their highest degree in the social sciences.

  • Respondents were evenly distributed across analytics/polling firms, issue or advocacy organizations, and labor unions.

  • Most respondents work in the fields of general data management or analytics.

  • 37% of all respondents were managers, but this varies dramatically by gender: only 28% of women but 43% of men were managers. The likelihood of being a manager does not meaningfully vary between white respondents and people of color.

Salary: The median salary reported was $70,000 to $74,999, but there is substantial variation in salary:

  • Non-whites had a lower median salary at $65,000 to $69,000 versus $75,000 to $79,000 for whites. This gap persists across years of experience.

  • Men and women had the same median salary at $70,000 to $74,999.

  • Entry-level employees had a median salary of $55,000 to $59,999; mid-level employees $65,000 to $69,999; and senior / department-head employees $90,000 to $94,999.

  • Non-managers had a median salary of $65,000 to $69,999 while managers of 1-4 staffers made $20,000 more.

  • Bachelor’s and Master’s degree holders make roughly the same amount, but PhD-holders (albeit a small sample) make substantially more.

  • In most fields, the percent of time spent writing code is uncorrelated with salary, and indeed, most technical skills are not correlated with increases in salary. However, engineers appear to make more (with a median of $85,000 to $89,999) than those working in data management ($70,000 to $74,999) or analytics ($75,000 to $79,999).

Negotiation: About half of all respondents who were eligible to negotiate a salary did so, and of those who did, 73% increased their compensation at a median rate of 5-10% increase over base. Women were slightly more likely than men to negotiate, but of those who increased their compensation, 48% of men negotiated salary increases of 10%+ while only 31% of women did the same.

Tools: The most commonly used tools are Excel, SQL, and VAN with 90%+ of respondents reporting that they had used each at least once.

  • Knowledge of programming outside of SQL is rare, with only 25% of respondents at most reporting “Intermediate” or “Advanced” knowledge of a language such as R, Python, Javascript / HTML, Stata, or Ruby.

  • Most tools are learned outside of school, either on the job or through other means.

  • Men were substantially more likely than women to rate themselves as intermediate / advanced users. However, the gender gap narrows substantially when looking at often people use those skills.

Skills: The most commonly used skills are transforming data and generating reports in SQL; managing and reviewing others’ analysis or work; creating voter contact universes; presenting analyses to non-technical staff; debugging code; pitching projects; and coordinating groups. Fewer than half of respondents reported running regressions, and only 25% reported building a predictive model.

Career Plans: About half of respondents plan on staying at the same organization for the next year, and 19% reported a desire to leave politics.

  • Asked where they expected to be working a year from now, 40% of respondents indicated interest in a political campaign (only 10% of respondents currently work on a political campaign).

  • When asked about the next step in their career, 57% of respondents wanted to learn new skills while 45% wanted to move into management.

  • Respondents diverged on the single organization they would be most excited to work at with 40% of respondents opting to not respond at all. Of the 161 respondents who did respond, Civis Analytics ranked #1 with 15 votes (9%), followed by the Analyst Institute, BlueLabs, and the DNC.

Respondent Characteristics

Demographics

Gender

What is your gender identity?

Proportion N
Male 56% 152
Female 42% 115
Genderqueer / Gender non-conforming 1% 2
Trans female / Trans woman 0% 1
Trans male / Trans man 0% 0
Other 1% 3

For context, last year’s salary survey was 52% Female, 47% Male, and 1% Other.

In all subsequent analyses, trans* were coded as male / female.

Race / Ethnicity

What is your race / ethnicity? Please select all that apply.

Proportion N
White 76% 208
Asian or Asian American (including South Asian) 8% 21
Black or African American 4% 10
Hispanic or Latino 4% 10
Middle Eastern 1% 3
American Indian or Alaska Native 0% 1
Multi-Racial 7% 18
Other 1% 2

For context, last year’s salary survey was also about 75% white.

Note: Respondents who selected multiple racial categories are coded here as “Multi-Racial”.

Age

What is your age?

Age was not asked in last year’s salary survey.

Sexuality

Do you consider yourself to be …?

Proportion N
Heterosexual or straight 79% 217
Gay or Lesbian 10% 28
Bisexual 7% 20
Different identity 2% 6
Refused 1% 2

Disability

You are considered to have a disability if you have a physical or mental impairment or medical condition that substantially limits a major life activity, or if you have a history or record of such an impairment or medical condition.

Proportion N
Yes, I have or previously had a disability 8% 21
No, I don’t have a disability 92% 251
Refused 0% 1

Geography

Country

What country do you live in?

Proportion N
United States of America 99% 271
Canada 0% 1
United Kingdom 0% 1

Area

What’s your zip code? [only asked to US respondents, responses coded to Census metropolitan areas]

Proportion N
Washington-Arlington-Alexandria, DC-VA-MD-WV 49% 130
New York-Newark-Jersey City, NY-NJ-PA 7% 19
Chicago-Naperville-Elgin, IL-IN-WI 5% 13
Boston-Cambridge-Newton, MA-NH 4% 10
San Francisco-Oakland-Hayward, CA 3% 7
Milwaukee-Waukesha-West Allis, WI 2% 6
Seattle-Tacoma-Bellevue, WA 2% 6
Denver-Aurora-Lakewood, CO 2% 5
Las Vegas-Henderson-Paradise, NV 2% 5
Columbus, OH 2% 4
Minneapolis-St. Paul-Bloomington, MN-WI 2% 4
Durham-Chapel Hill, NC 1% 3
Los Angeles-Long Beach-Anaheim, CA 1% 3
Philadelphia-Camden-Wilmington, PA-NJ-DE-MD 1% 3
Portland-South Portland, ME 1% 3
Portland-Vancouver-Hillsboro, OR-WA 1% 3
Baltimore-Columbia-Towson, MD 1% 2
Boise City, ID 1% 2
Boulder, CO 1% 2
Dallas-Fort Worth-Arlington, TX 1% 2
Des Moines-West Des Moines, IA 1% 2
New Orleans-Metairie, LA 1% 2
Pittsburgh, PA 1% 2
St. Louis, MO-IL 1% 2
Tampa-St. Petersburg-Clearwater, FL 1% 2

Other locations with one respondent were Allentown-Bethlehem-Easton, PA-NJ; Atlanta-Sandy Springs-Roswell, GA; Augusta-Waterville, ME; Bangor, ME; Bremerton-Silverdale, WA; Burlington-South Burlington, VT; Columbia, SC; Detroit-Warren-Dearborn, MI; Glenwood Springs, CO; Green Bay, WI; Houston-The Woodlands-Sugar Land, TX; Kansas City, MO-KS; Little Rock-North Little Rock-Conway, AR; Louisville/Jefferson County, KY-IN; Miami-Fort Lauderdale-West Palm Beach, FL; Missoula, MT; Phoenix-Mesa-Scottsdale, AZ; Raleigh, NC; San Diego-Carlsbad, CA; San Jose-Sunnyvale-Santa Clara, CA; Santa Rosa, CA; Tallahassee, FL; Tucson, AZ.

Education

Highest Degree

What is the highest level of education that you have completed?

Proportion N
No Bachelor’s Degree 8% 22
Bachelor’s Degree 61% 166
Post-bachelor’s Work, no Higher Degree 5% 13
Master’s or Professional Degree (MA, MPP, JD, etc.) 22% 61
Doctoral Degree (PhD) 4% 11

For more on education, take a look at the Appendix.

Field of Study

The field of study for my most recent degree is… [only asked to respondents who have completed at least a Bachelor’s degree]

Proportion N
Social Sciences (Political Science, Economics, Policy, Law, etc.) 68% 171
Humanities (Philosophy, English, Art, etc.) 10% 25
Applied Sciences (Engineering, Computer Science, etc.) 7% 17
Formal Sciences (Mathematics, Statistics, etc.) 7% 17
Natural Sciences (Chemistry, Physics, Biology, etc) 3% 8
Other / I’m not sure 5% 13

Employment Status

Current Status

What is your current employment status?

Proportion N
Full-time at one or more jobs 86% 236
Part-time at one or more jobs 0% 1
Freelance / contracting / self-employed 7% 19
In school 1% 2
Unemployed 5% 13
Other 1% 2

Other responses included working full-time at one job with freelance work and doing full-time corporate work with side work in progressive politics.

Involvement in Data / Analytics / Tech

  • Is the primary focus (>40% of resources) of your organization data, analytics, or technology?

  • Is the primary focus (>40% of resources) of your team data, analytics, or technology?

  • Is the primary focus (>40% of time) of your role data, analytics or technology?

Work Experience

Politics & Data

How many years of work experience do you have in progressive politics in data, analytics, and technology (i.e., how many years have you been a progressive data, analytics, or technology practitioner)?

Politics, Not Data

How many years of work experience do you have in progressive politics but not in data, analytics, and technology (i.e., exclude any years worked in data, analytics, and technology)?

Data, Not Politics

How many years of work experience do you have in data, analytics, and technology but not in progressive politics?

Total

Most people’s experience in data and analytics comes exclusively from politics.

Job Characteristics

Organization Type

How would you describe the organization?

Proportion N
Analytics / Polling firm 19% 51
Issue or Advocacy Organization 17% 47
Labor union 17% 46
Vendor (e.g., technology vendor) 13% 35
Political campaign 10% 27
Other consulting firm (media, field, digital, etc.) 10% 26
Party committee 7% 18
Non-issue-specific Independent Expenditure group 4% 10
Other 5% 13

Primary Job Function

What is your primary job function? If in management, please indicate the primary job function of your team.

Proportion N
General data management and reporting 26% 71
General analytics or data science 25% 67
General field/grassroots-focused data (e.g. VAN admin) 13% 36
Consulting / client relations 8% 23
Polling and Research 8% 22
Engineering / software development 6% 16
Digital data and analytics 5% 13
Product / Project management 4% 12
Development / fundraising 1% 2
Other 4% 11

Seniority

How would you describe your level of seniority within the organization?

Proportion N
Entry-Level 15% 40
Mid-Level 38% 103
Senior-Level 23% 63
Department Head 20% 55
Organization Head 3% 7
Other 1% 4
Refused 0% 1

Management

How many full-time staffers do you manage? Please include everyone who reports “up the chain” to you, both directly or through layer(s) of management.

Overall

Proportion N
0 staffers 63% 173
1-4 staffers 27% 75
5-9 staffers 5% 13
More than 10 staffers 4% 12

By Gender

All
(n = 273)
Female/Other
(n = 121)
Male
(n = 152)
0 staffers 63% 72% 57%
1-4 staffers 27% 20% 34%
5-9 staffers 5% 3% 6%
More than 10 staffers 4% 5% 4%

By Race

All
(n = 273)
POC
(n = 65)
White
(n = 208)
0 staffers 63% 66% 62%
1-4 staffers 27% 26% 28%
5-9 staffers 5% 6% 4%
More than 10 staffers 4% 2% 5%

Time Writing Code

What percentage of your time do you spend directly conducting analysis or writing code — as opposed to, e.g., communicating with external partners or managing staff?

Overall

The mean percent of time spent writing code is 45.8%. The median percent of time spent writing code is 40.5%.

By Seniority

By Job Type

Salary Overview

Please describe the total expected annual pre-tax income, including bonuses or commissions. This figure may be salaried or unsalaried.

Salary Distribution

The median salary is $70,000 to $74,999.

Proportion N
Under $20,000 0% 1
$20,000 to $24,999 0% 0
$25,000 to $29,999 0% 1
$30,000 to $34,999 1% 3
$35,000 to $39,999 1% 4
$40,000 to $44,999 2% 5
$45,000 to $49,999 6% 17
$50,000 to $54,999 7% 19
$55,000 to $59,999 7% 19
$60,000 to $64,999 10% 27
$65,000 to $69,999 7% 19
$70,000 to $74,999 12% 34
$75,000 to $79,999 5% 13
$80,000 to $84,999 6% 17
$85,000 to $89,999 6% 17
$90,000 to $94,999 4% 11
$95,000 to $99,999 3% 8
$100,000 to $104,999 4% 11
$105,000 to $109,999 3% 8
$110,000 to $114,999 2% 5
$115,000 to $119,999 3% 7
$120,000 to $124,999 1% 2
$125,000 to $129,999 3% 7
$130,000 to $134,999 1% 3
$135,000 to $139,999 1% 2
$140,000 to $144,999 0% 1
$145,000 to $149,999 0% 1
$150,000 to $154,999 1% 3
$155,000 to $159,999 0% 1
$160,000 to $164,999 0% 1
$165,000 to $169,999 0% 1
$170,000 to $174,999 0% 1
$175,000 to $179,999 0% 1
$180,000 to $184,999 0% 1
$185,000 to $189,999 0% 0
$190,000 to $194,999 0% 0
$195,000 to $199,999 0% 0
$200,000+ 1% 2

For numeric analyses, salary was recorded as the midpoint of the interval. For those reporting salary under $20,000, the value recorded was $20,000, and for those reporting salary over $200,000, the value recorded was $200,000.

Benefits

Which of the following benefits are you personally eligible for? Select all that apply.

Proportion
Health insurance 92%
Paid vacation days 86%
Paid sick days 83%
401(k) or other retirement plan 71%
Ability to work remotely 60%
Paid parental leave 55%
401(k) matching 54%
Organizational bonding activities 43%
Continuing education / professional development 40%
Pension 12%
Stock / Equity in organization 11%
Other 6%
Day care 1%

Other benefits listed included travel benefits, bonuses / profit sharing, technology stipends, annuity and vacation funds, free food, a staff union, adoption support, and sabbatical.

Negotiation

During your last job offer or performance review, did you try to negotiate your salary?

Proportion N
Yes 44% 120
No 40% 110
Not Applicable (union, freelancer, etc.) 16% 43

Was your negotiation successful? Please select all that apply. [only asked to respondents who attempted a negotiation]

Proportion
Yes, I increased my compensation 73%
Yes, I improved my title 21%
Yes, I increased my benefits 8%
No, I did not gain improved compensation, benefits, or title 23%

What was % increase in compensation that you negotiated?

For example, if your base salary is $50,000 and you negotiated a raise of $5,000, that is a 10% increase ($5,000 / $50,000). [only asked to respondents who reported an increase in compensation after negotiating]

Proportion N
0-5% 23% 20
5-10% 38% 33
10-15% 17% 15
15-20% 11% 10
20%+ 11% 10

You can also view negotiation outcomes by gender and race.

Tools and Skills

Tools

How comfortable are you with the following tools?

  • Never used this before: Maybe you’ve heard of this tool, but you’ve never used it in or outside of work
  • Introductory: You have maybe read a blog post or completed a tutorial about this tool, but you haven’t used this in a major project
  • Novice: You’ve used this a few times or use it at work, but you’re still learning how it works
  • Intermediate: You feel comfortable using this tool
  • Advanced: You are at home using this tool, may be the “local expert” on it at your organization, or could lead a training on this topic

Please see the Appendix for an analysis of gender disparities in self-reported skill level and frequency. (Hint: the gap in the latter is much smaller than in the former!)

Exposure

This graph displays the proportion of people who selected “Never used this before” versus any of the other options.

Please note that some of the tools listed in the graph have been abbreviated.1

Skill Level

This graph displays the full distribution of responses to skill level. Responses are ordered by the proportion of respondents who rate themselves as having intermediate or advanced skills.

Frequency

How often do you use these skills in your job? [only asked if respondent selected “Introductory”, “Novice”, “Intermediate”, or “Advanced” in response to skill level]

Learn

How did you primarily learn these tools? Please pick the closest option. [only asked if respondent selected “Introductory”, “Novice”, “Intermediate”, or “Advanced” and only asked about a subset of tools]

For more analysis on gender differences, please see the Appendix.

Self-Taught versus Taught by Others

N Self-Taught Taught by Others
JS/HTML/CSS 174 82% 18%
Ruby 51 78% 22%
Python 203 70% 30%
R 186 69% 31%
Command line tools 206 65% 35%
GIS, QGIS, ArcGIS 203 62% 38%
SQL 265 56% 44%
Stata/SPSS 131 30% 70%

Job, School, or Other

N Job School Other
SQL 265 81% 7% 12%
Command line tools 206 61% 10% 29%
GIS, QGIS, ArcGIS 203 60% 12% 28%
Ruby 51 49% 2% 49%
Python 203 46% 15% 39%
R 186 39% 31% 30%
JS/HTML/CSS 174 36% 16% 48%
Stata/SPSS 131 21% 71% 8%

Skills

Which of the following items have you personally done in the last year? Please select all that apply.

Management

Proportion
Manage and review others’ analysis or work 72%
Present the results of a poll, experiment, model, or another analysis for non-technical leadership 62%
Pitch a project to a funder or member of senior leadership 50%
Coordinate a group of organizations to coordinate or collaborate on program 45%
Hire or fire staff 34%
Create a professional development plan for others 25%

Technical

Proportion
Transform data and generate reports with SQL 74%
Create voter contact universes 62%
Debug existing code 53%
Run regressions and other analysis using a statistical package 40%
Work with data via API endpoints 38%
Analyze text data, e.g., open text survey responses 37%
Design, implement, and analyze a field experiment 30%
Manage the development of a software product 29%
Wrote code for a large-scale software project, such as a web application or data pipeline 29%
Write, field, and analyze a poll for your organization or clients 27%
Build a predictive model (turnout, support, issue, action, etc). 25%
Set up a server, deploy code to a production environment, or other DevOps work 19%

Open-Ended

Please describe any other major components of your work.

Responses to this question included training, managing data tools and processes, explaining data and reporting to principals, research (both quantitative and not), database management, and client relations.

Salary Crosstabs

In all of the following crosstabs, salary information is excluded for groups with fewer than 5 people.

Respondent Characteristics

Gender

Category N Mean Median
Male 152 $84,342 $70,000 to $74,999
Female/Other 121 $74,917 $70,000 to $74,999

Race

Collapsing racial categories in white / non-white:

Category N Mean Median
White 208 $83,113 $75,000 to $79,999
POC 65 $70,731 $65,000 to $69,999

With all racial categories displayed:

Category N Mean Median
White 208 $83,113 $75,000 to $79,999
Asian or Asian American (including South Asian) 21 $61,310 $55,000 to $59,999
Multi-Racial 18 $72,500 $70,000 to $74,999
Black or African American 10 $65,000 $60,000 to $64,999
Hispanic or Latino 10 $79,500 $65,000 to $69,999
Middle Eastern 3
Other 2
American Indian or Alaska Native 1

Gender & Race

Category N Mean Median
Male White 119 $87,710 $80,000 to $84,999
Female/Other White 89 $76,966 $70,000 to $74,999
Male POC 33 $72,197 $60,000 to $64,999
Female/Other POC 32 $69,219 $65,000 to $69,999

Age

Category N Mean Median
Under 20 1
20-24 31 $54,919 $50,000 to $54,999
25-29 103 $75,024 $70,000 to $74,999
30-34 82 $87,927 $80,000 to $84,999
35-39 40 $93,250 $90,000 to $94,999
40-44 13 $86,538 $85,000 to $89,999
45-49 2
50-54 0
55-59 0
60-64 1
65+ 0

Sexuality

Category N Mean Median
Heterosexual or straight 217 $81,993 $70,000 to $74,999
Gay or Lesbian 28 $78,661 $70,000 to $74,999
Bisexual 20 $71,000 $60,000 to $64,999
Different identity 6 $55,833 $50,000 to $54,999
Refused 2

Disability

Category N Mean Median
No, I don’t have a disability 251 $79,761 $70,000 to $74,999
Yes, I have or previously had a disability 21 $81,548 $80,000 to $84,999
Refused 1

Education

Highest Degree

Category N Mean Median
Under BA 22 $89,886 $80,000 to $84,999
BA 179 $77,025 $70,000 to $74,999
Masters 61 $78,689 $70,000 to $74,999
PhD 11 $120,000 $120,000 to $124,999

For more on education, take a look at the Appendix.

Field of Study

Category N Mean Median
Social Sciences 171 $79,035 $70,000 to $74,999
Humanities 26 $88,077 $75,000 to $79,999
Applied Sciences 18 $78,472 $70,000 to $74,999
Formal Sciences 17 $78,382 $70,000 to $74,999
Other / Not Sure 14 $73,571 $65,000 to $69,999
Natural Sciences 8 $65,000 $55,000 to $59,999

Work Experience

Job Characteristics

Organization

Category N Mean Median
Analytics / Polling 51 $78,922 $70,000 to $74,999
Issue / Advocacy 47 $75,479 $65,000 to $69,999
Labor union 46 $83,913 $80,000 to $84,999
Vendor 35 $92,643 $80,000 to $84,999
Campaign 27 $63,796 $70,000 to $74,999
Other consulting 26 $97,692 $85,000 to $89,999
Party 18 $63,333 $60,000 to $64,999
Other 13 $90,577 $100,000 to $104,999
Non-Issue IE 10 $63,000 $50,000 to $54,999

Seniority

Category N Mean Median
Entry-Level 40 $58,375 $55,000 to $59,999
Mid-Level 103 $70,218 $65,000 to $69,999
Senior-Level 63 $95,238 $90,000 to $94,999
Department Head 55 $98,455 $90,000 to $94,999
Organization Head 7 $77,857 $70,000 to $74,999
Other 4
Refused 1

Management

Category N Mean Median
0 staffers 173 $71,286 $65,000 to $69,999
1-4 staffers 75 $88,967 $85,000 to $89,999
5-9 staffers 13 $99,808 $100,000 to $104,999
More than 10 staffers 12 $131,875 $125,000 to $129,999

Primary Job Function

Category N Mean Median
Data Management 71 $73,979 $70,000 to $74,999
Analytics 67 $82,985 $75,000 to $79,999
Field 36 $64,722 $55,000 to $59,999
Consulting / client work 23 $94,022 $85,000 to $89,999
Polling 22 $73,864 $65,000 to $69,999
Engineering 16 $103,125 $85,000 to $89,999
Digital 13 $75,577 $65,000 to $69,999
Product / Project Management 12 $89,167 $80,000 to $84,999
Other 11 $99,318 $95,000 to $99,999
Fundraising 2

% Writing Code

There is almost no relationship between percent time writing code and salary across management and job functions. For more information, please see the Appendix.

Tools and Skills

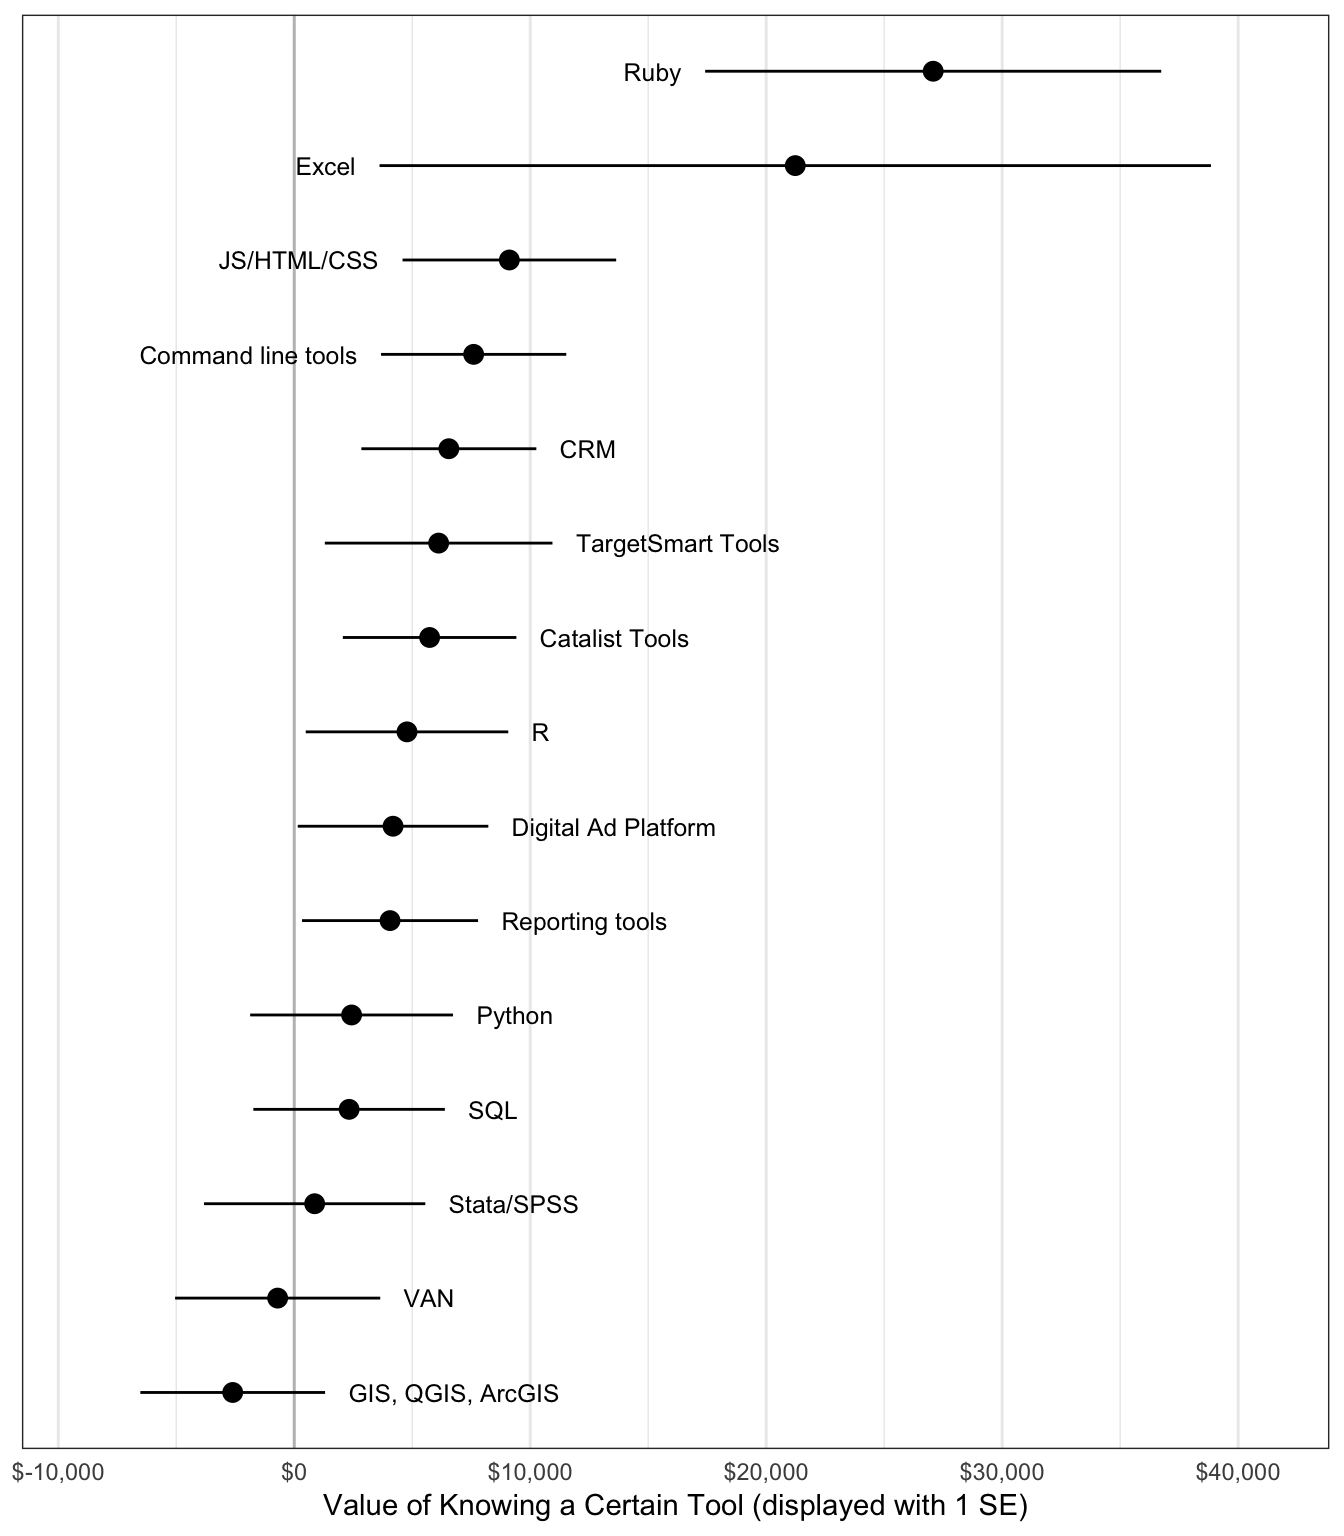
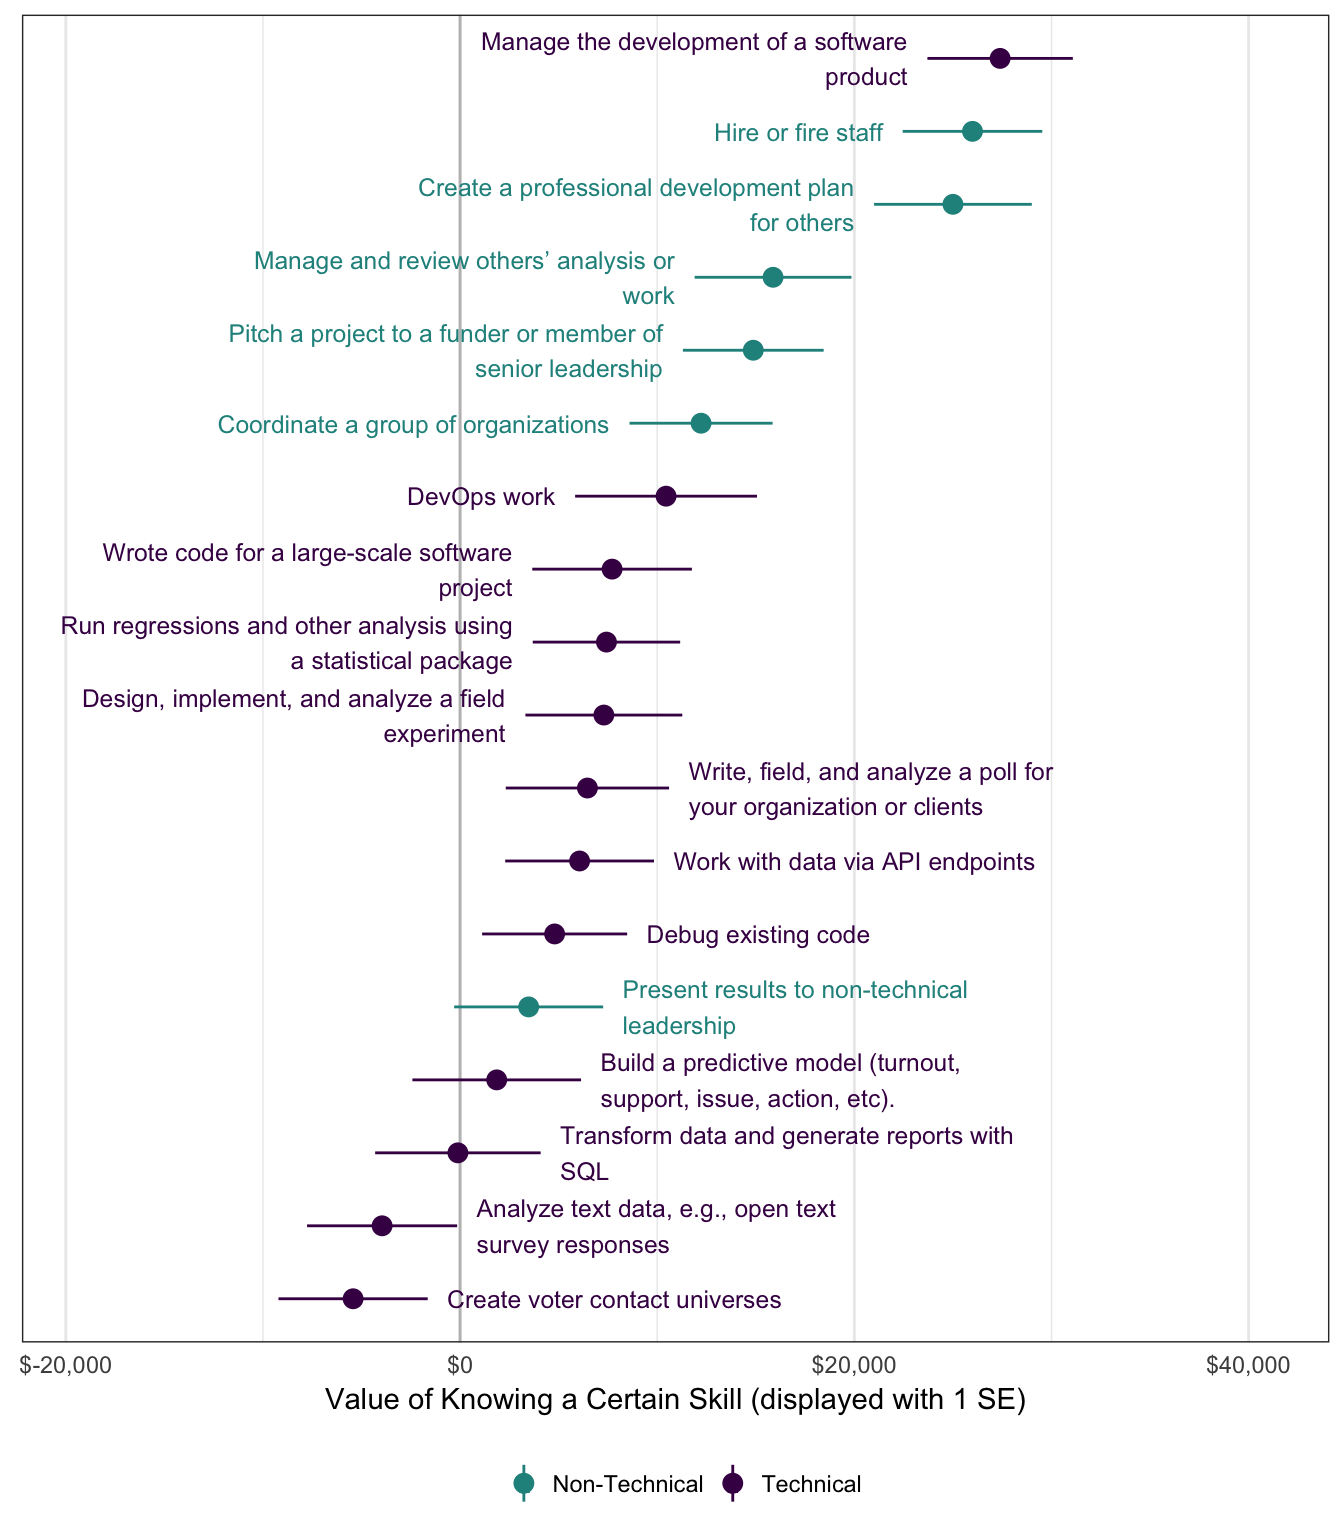
These graphs show the result of bivariate regressions of salary against a specific tool / skill. The point represents the predicted change in salary for knowing versus not knowing the tool / skill, and the line around it represents an interval of 1 standard error.

Tool

Skill

Career Plans

Next Step

Which of the following most accurately describes the next step you would like to take to advance your career? Please select all that apply.

Proportion
Learn new skills or tools related to data, analytics, and technology 57%
Move into management or a more senior management role 45%
Work on more interesting/important projects as an individual contributor (i.e., not a manager) 29%
Stay in a similar role but move to another organization 26%
I’m happy where I am 26%
Leave politics 19%
Stay in politics but move out of data, analytics, and technology 12%
Start my own organization 10%
Other 5%

Write-in responses included wanting to work on a campaign, finishing school, rebuilding the union, growing an organization, leaving the US, and undecided.

For respondents who indicated that they wanted to leave politics, we asked an open-ended question about why they wanted to leave. Topics mentioned included

  • Poor work-life balance (17)
  • Lack of interest (15)
  • Salary (8)
  • Bad management (7)
  • Lack of opportunities (5)
  • Location (3)

Note that some responses mentioned multiple topics.

Plans to Leave

Are you planning to leave your organization within the next year? [only asked if respondent’s current employment status was not “Unemployed” or “Freelance”]

Proportion N
I plan to actively look for new opportunities 17% 42
I might leave, but I’m not sure 35% 84
I’m not planning to leave 48% 115

Expect to be in One Year

Where do you want or expect to be working a year from now? Select all that apply. [only asked if respondents indicated (to the question about where they would be in one year) if they planned to actively look for new opportunities or if they might leave or if they indicated (to the question about next career steps) if they planned to move to another organization.]

Proportion
Analytics / Polling firm 50%
Issue or Advocacy Organization 46%
Political campaign 40%
Vendor (e.g., technology vendor) 32%
Other consulting firm (media, field, digital, etc.) 31%
Labor union 25%
Party committee 25%
Non-issue-specific Independent Expenditure group 17%
In School 12%
Other 22%

Top Choice Organization

Thinking about the progressive data, analytics, and technology space, which one specific organization would you be most excited to work at? (Write-in)

161 respondents answered this question out of 273 total respondents. The proportions below display the percentage among those who responded. For a breakdown of these responses by gender and race, take a look at the Appendix.

Proportion N
Civis Analytics 9% 15
Analyst Institute 9% 14
BlueLabs 8% 13
Democratic National Committee (DNC) 8% 13
Planned Parenthood Federation of America (PPFA) 5% 8
2020 Presidential 4% 6
Clarity Campaign Labs 3% 5
Google 3% 5
Catalist 2% 4
Democratic Congressional Campaign Committee (DCCC) 2% 4
NGP VAN 2% 4

The following organizations each had 3 votes: American Federation of Labor and Congress of Industrial Organizations (AFL-CIO), Freelance, National Democratic Redistricting Committee (NDRC), Obama Foundation

The following organizations each had 2 votes: American Civil Liberties Union (ACLU), American Federation of State, County and Municipal Employees (AFSMCE), Center for American Progress (CAP), City Government, Democratic Legislative Campaign Committee (DLCC), Gates Foundation, Global Strategies Group (GSG), Minerva Insights, National Education Association (NEA), Other, Pew Research, TargetSmart, Wellstone

The following organizations each had 1 vote: 18F, Action Network, Airbnb, America Votes, Association of Community Organizations for Reform Now (ACORN), Catalyst, Color of Change, Democracy Works, Democratic Senatorial Campaign Committee (DSCC), Emily’s List, Empower Engine, Every Town, Facebook, Federal Government, Gubernatorial Campaign, HaystaqDNA, Hustle, League of Conservation Voters (LCV), National Democratic Institute (NDI), National Security Agency (NSA), Precision Strategies, Progressive Change Campaign Committee (PCCC), Service Employees International Union (SEIU), ShareProgress, Sierra Club, Stacey Abrams for GA, State Party, The Victory Fund, Ultraviolet, United We Dream, US Census, US Institute of Peace

Notes

Eligibility

Respondents were only eligible to take this survey if (1) they worked in progressive politics AND (2) if their organization, role, or team focused on data, analytics, or technology.

Respondents satisfied the first criteria if they answered “Yes” to one of the following two questions:

  • Do you currently work at an organization that either works in progressive politics or has some clients who work in progressive politics? Or, if you freelance, do you have some clients that work in progressive politics?

  • Within the last 12 months, have you worked at an organization that either works in progressive politics or has some clients who work in progressive politics? Or, if you freelanced, did you have some clients that worked in progressive politics?“2

If the answer to both was “No”, the respondent was not permitted to proceed with the survey.

The second criteria was satisfied if the respondents answered “Yes” to one or more of the following questions:

  • Is the primary focus (>40% of resources) of your organization data, analytics, or technology?
  • Is the primary focus (>40% of resources) of your team data, analytics, or technology?
  • Is the primary focus (>40% of time) of your role data, analytics or technology?

We received some comments that this design excluded individuals who left progressive politics or who worked in government. For those interested in government jobs, we recommend looking on government websites, where salary information is publicly available. While the perspectives of those who left progressive politics are valuable for improving the field, they are somewhat outside the scope of this survey, and data on salaries in commercial organizations are available on sites such as Glassdoor.

For Next Year

Based on the comments to this year’s survey, here are some notes for what might be changed for next year:

  • More questions around management
  • Clarify definitions even more, particularly around how skills are acquired
  • Conduct a separate survey of people who have left politics on why they left
  • How did people receive this survey? A listserv? Their workplace? Other?
  • Targeted outreach to firms in this space
  • Targeted outreach to engineers

Design

This survey was hosted on Qualtrics. The data was analyzed using R, and this analysis was written using R Markdown using the flatly theme.

It makes heavy use of ggplot2, viridis, and formattable. There may also be some marginally gratuitous graphs made using ggjoy.

Annie is #teamtidyverse.

Author and Thanks

This year’s salary survey was written and analyzed by Annie J. Wang, who can be reached at anniejw6@gmail.com if you have questions, comments, or concerns.

I am grateful to the following people for reviewing and/or disseminating the survey (listed alphabetically): Amir Arman, Brett Benson, Bridgit Donnelly, Amanda Coulombe, Jenn Cervella, Kevin Collins, Anna Cooper, Will Cubbison, Kass DeVorsey, Jess Garson, Dessa Gypalo, Lara Helm, Amanda Hoey, Matt Johnson, Darren Kinnaird, Warren Linam, Jamie Michelson, Drew Miller, Amit Mistry, Nat Olin, Anupama Pillalamarri, Jonathan Robinson, Olivia Robinson, Michael Sadowsky, Cristina Sinclaire, Aaron Strauss, Susanna Supalla, Lena Tom, Tony Whittaker, and Victoria Yu.

And the biggest thank you goes to everyone who took the survey!

Appendix

Skill Breakouts

These tables display the proportion of respondents within a category who identified as Intermediate or Advanced in a skill.

By Organization Type

By Primary Job Function

Tools and Skills by Gender

It turns out that across all skills and all tools, men are more likely to say that they have them. But are they as likely to actually have or use them?

Tool Assessment vs Frequency of Use By Gender

Across all of the statistics / programming tools that we asked about, a greater proportion of men than women rated themselves as “Intermediate” or “Advanced.” But does this mean that men are actually more skilled, or that they are more likely to rate themselves as more skilled?

% Reporting “Intermediate or Advanced”:

Male Female/Other Difference
SQL 79% 61% 18%
Command line tools 38% 24% 14%
Python 30% 17% 12%
R 29% 18% 11%
GIS, QGIS, ArcGIS 36% 30% 6%
Ruby 6% 1% 5%
JS/HTML/CSS 22% 18% 4%
Stata/SPSS 17% 21% -4%

We couldn’t just administer a skills test on this survey, but we could ask how often people used certain tools as a proxy for actual skill level.

% Reporting “Use multiple times per week” (highest possible frequency):

Male Female/Other Difference
SQL 62% 50% 12%
Python 20% 14% 6%
Command line tools 30% 25% 5%
Stata/SPSS 5% 1% 4%
JS/HTML/CSS 9% 5% 4%
GIS, QGIS, ArcGIS 11% 7% 3%
R 15% 14% 1%
Ruby 3% NA NA

This chart combines both of those tables: turns out, the gender gap is a lot smaller when you ask how often people use certain skills instead of their self-perception of their skill level. One implication for hiring may be that it makes more sense to ask about the frequency of how people use certain tools or skills rather than a judgement of skill level.

Learning by Gender

Across all skills, men are more likely to say that those skills were “self-taught” rather than “taught by others”.

And yet, the gender differential on where those skills are acquired is much smaller. Similar proportions of men and women report learning those skills on the job versus at school versus neither.

Is it the case that men are less likely to receive instruction at work, or are they just less likely to report that they were instructed?

Skills by Gender

Across all skills … men are more likely to state that they have them, but some cases more so than others.

Non-Technical

Technical

Negotiation Outcomes by Demographics

Gender

During your last job offer or performance review, did you try to negotiate your salary?

All
(n = 273)
Female/Other
(n = 121)
Male
(n = 152)
Yes 44% 49% 40%
No 40% 35% 45%
Not Applicable (union, freelancer, etc.) 16% 17% 15%

Was your negotiation successful? Please select all that apply. [only asked to respondents who attempted a negotiation]

All
(n = 120)
Female/Other
(n = 59)
Male
(n = 61)
Yes, I increased my compensation 73% 71% 75%
Yes, I increased my benefits 8% 3% 11%
Yes, I improved my title 21% 22% 20%
No, I did not gain improved compensation, benefits, or title 23% 24% 23%

What was % increase in compensation that you negotiated?

For example, if your base salary is $50,000 and you negotiated a raise of $5,000, that is a 10% increase ($5,000 / $50,000). [only asked to respondents who reported an increase in compensation after negotiating]

All
(n = 88)
Female/Other
(n = 42)
Male
(n = 46)
0-5% 23% 17% 28%
5-10% 38% 52% 24%
10-15% 17% 12% 22%
15-20% 11% 12% 11%
20%+ 11% 7% 15%

Race

During your last job offer or performance review, did you try to negotiate your salary?

All
(n = 273)
POC
(n = 65)
White
(n = 208)
Yes 44% 52% 41%
No 40% 34% 42%
Not Applicable (union, freelancer, etc.) 16% 14% 16%

Was your negotiation successful? Please select all that apply. [only asked to respondents who attempted a negotiation]

All
(n = 120)
POC
(n = 34)
White
(n = 86)
Yes, I increased my compensation 73% 74% 73%
Yes, I increased my benefits 8% 3% 9%
Yes, I improved my title 21% 12% 24%
No, I did not gain improved compensation, benefits, or title 23% 26% 22%

What was % increase in compensation that you negotiated?

For example, if your base salary is $50,000 and you negotiated a raise of $5,000, that is a 10% increase ($5,000 / $50,000). [only asked to respondents who reported an increase in compensation after negotiating]

All
(n = 88)
POC
(n = 25)
White
(n = 63)
0-5% 23% 28% 21%
5-10% 38% 44% 35%
10-15% 17% 4% 22%
15-20% 11% 12% 11%
20%+ 11% 12% 11%

Top Choice Firms by Demographics

Gender

Firm Female/Other Male Total
Civis Analytics 3 12 15
Analyst Institute 6 8 14
BlueLabs 6 7 13
Democratic National Committee (DNC) 5 8 13
Planned Parenthood Federation of America (PPFA) 7 1 8
2020 Presidential 4 2 6

Race

Firm POC White Total
Civis Analytics 4 11 15
Analyst Institute 5 9 14
BlueLabs 3 10 13
Democratic National Committee (DNC) 2 11 13
Planned Parenthood Federation of America (PPFA) 1 7 8
2020 Presidential 1 5 6

% Time Writing Code vs Salary

By Management Level

By Job Function

Should I go back to school?

While PhD-holders might have substantially different outcomes than BA-holders, it looks like Masters degrees are not particularly helpful.

All
(n = 273)
Under BA
(n = 22)
BA
(n = 178)
Masters
(n = 61)
PhD
(n = 11)
Entry-Level 15% 18% 16% 13% 0%
Mid-Level 38% 23% 38% 46% 18%
Senior-Level 23% 36% 22% 20% 36%
Department Head 20% 18% 21% 15% 36%
Organization Head 3% 0% 1% 7% 9%
Other 1% 5% 2% 0% 0%

There is virtually no difference in BA-holders and Masters-holders in management status.

All
(n = 273)
Under BA
(n = 22)
BA
(n = 179)
Masters
(n = 61)
PhD
(n = 11)
0 staffers 63% 64% 65% 66% 18%
1-4 staffers 27% 18% 27% 30% 45%
5-9 staffers 5% 5% 5% 2% 18%
More than 10 staffers 4% 14% 3% 3% 18%

  1. “Digital Ad Platform” was listed in the survey as “Digital Ad platform (Facebook, Google, etc.)”; “Catalist Tools” was listed as “Catalist Tools (Q Tool, etc.)”; “TargetSmart Tools” was listed as “TargetSmart Tools (ListBuilder, etc.)”; “CRM” was listed as “CRM (Salesforce, Action Network, Mailchimp, etc.)”; “Reporting tools” was listed as “Reporting software such as Tableau or Periscope”; and “Excel” was listed as “Excel / Google Sheets”.

  2. If the respondent does not currently work in progressive politics, all questions used the past tense and referred to the respondent’s previous job (in progressive politics).